A compilation of some projects are:
1. Oil In
Water Monitor
The Theory behind water content monitoring |
In 1908 the German Scientist Gustav Mie
presented a description on how particles
scatter light.
The particles must be big compared to the
wavelength of the incident light. By cutting
the particle
in slices he was able to put the particle
shape, the complex refractive index and
phase into account.
This description resulted in the theory for
spheres of arbitrary size, the Mie theory.
Although not only
Mie contributed to this theory, its wide
spread use of this name is adopted in this
thesis.
The Mie theory is commonly used by (astro)physics,
meteorologists, biologists and chemists. The
Dutchman P.J. Verheijen et al. have written
a program to calculate the predicted
scattered field.
In the current applied optics, the Dutch
physicist H.C. van de Hulst has contributed
a lot with his
book “Light Scattering by Small Particles”
with respect to the numerical solution. In
almost every
article his book can be found in the
reference list.
Now we take a look at the formulas used in
the theory. I use the sequence used by Hong
Du and
Jao Zhang. Most books start with the Maxwell
equations but it is out of the scope of this
thesis to
fully go into these.At start we take a
look at the Mie coefficients: |
|
|
Equation 0 - 1 |
 |
|
|
|
Equation 0 - 2 |
 |
|
Mie introduced these coefficients and it
contains the Ricatti-Bessel functions.
They depend on the complex refreactive index
or the relative refractive index m, x
(equation 7-1) and
 and,
and, .
The relative refractive index is the ratio
between the complex refractive index of the
sphere divided by the complex refractive
index of the medium in which the sphere
exists. .
The relative refractive index is the ratio
between the complex refractive index of the
sphere divided by the complex refractive
index of the medium in which the sphere
exists.
The variable x is commonly used to give the
ratio between the radius of the sphere and
the wavelength.
|
|
|
Equation 0 - 3 |
 |
|
The Ricatti-Bessel functions
 and
and
 can be written like:
 and
and
W.J. Wiscombe uses z instead of x because
x us used in equation 8-3 but I will
continue to use x because it is commonly
used in Bessel functions. These Ricatti
Bessel functions uses the following
properties. |
|
|
Equation 0 - 4 |
 |
|
|
|
Equation 0 - 5 |
 |
|
|
|
Equation 0 - 6 |
 |
|
|
|
Equation 0 - 7 |
 |
|
|
|
Equation 0 - 8 |
 |
|
|
|
Equation 0 - 9 |
 |
|
|
|
Equation 0 - 10 |
 |
|
|
|
Equation 0 - 11 |
 |
|
Scattering amplitudes are defined by:
For the horizontal plane: |
|
|
|
Equation 0 - 12 |
for the perpendicular plane: |
|
|
|
Equation 0 - 13 |
a1 and b1 = coefficients (refraction index,
particle size, radii)
the p and t are functions and are given by
|
|
|
|
Equation 0 - 14 |
 |
|
|
|
Equation 0 - 15 |
 |
|
 = are associated Legrandre polynomials which
can be written as:
= are associated Legrandre polynomials which
can be written as: |
|
|
|
Equation 0 - 16 |
 |
|
|
|
Equation 0 - 17 |
 |
|
|
|
Equation 0 - 18 |
And the scattered field components are |
|
|
|
Equation 0 - 19 |
 |
|
|
|
Equation 0 - 20 |
The Extinction efficiencies are: |
|
|
|
Equation 0 - 21 |
 |
|
|
|
Equation 0 - 22 |
 |
|
Hence when the Mie theory and the Beer’s law
are combined the content and the
concentration can be determined. The
combination of these can result in an
algorithm that will predict the content
measurements and discrimination in an online
environment.
When there are multiple particles in the
incident light we have to add S1 for
particle, lets say a, and S2 for lets say b.
If we have only one point for measuring S
from a and b are in the same plane of the
incident light, θ is lightly shifted.
When a particle lets say c passes the
incident light just after as a has left the
light, the intensity at the photodetector
changes from a to c. If x from c is bigger
than x form a, the intensity detected at the
photodiode will increase if the photodiode
is placed ad a fixed small angle.
The operational amplifier connected to the
photodiode has a –3dB point to be calculated
with: |
|
|
Equation 0 - 23 |

With a flow of particles, each having an
average distance between each other of 1um
and the flow being 1m/s. the time between
two particles to pass the incident light
will be 1us. The cut-off frequency would be
100 kHz. This is a reasonable value to
detect but the incident light have a certain
length and therefore more than 100.000 with
x between a and c will extinct. Now we are
talking in regions of GHz. Not really a
useful number. If there was an amplifier
that could measure in the GHz regions the
capacitance of the integrating capacitor
would be smaller than the tracks to the
leads of the amplifier.
Hence the signal measured with a photodiode
is an integral over distribution and time
and angle. The angle integral is relatively
small compared to the distribution and time.
When we implement this knowledge into the
Mie formulas we see that we can change the
Mie coefficients.
The first change is due to the use of un
polarized light. If the result for the
horizontal and perpendicular plane is the
same we can say: |
|
|
Equation 0 - 24 |

This means that we can say |
|
|
|
Equation 0 - 25 |

 |
|
|
And being only wavelength and distribution
dependable. This frees us from the difficult
Bessel equations and leads us, only if the
distribution stays the same to: |
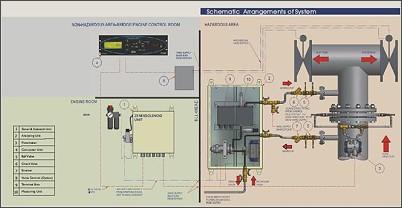
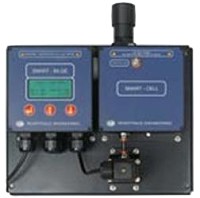
This theory is implemented in Oil in Water
Discharge Monitor. This system, in
concept/theory developed by Esquisse, is
sold by Rivertrace ltd. And Jowa.
Esquissed developed all electronics/
pcb’s and the applicable algorithms. It
contains intrinsically safe electronics and
Zener barriers.
Operating the equipment is extremely simple
with the use of the “three button” menu.
This prevents the user to make operational
mistakes.
Over 60% of all the new build ships all over
the world contain one of these systems.
Top
|
2. Bilge Water
Monitor |
|
With the same theory as the ODME, the Bilge
monitor developed. This equipment measures
the oil in water concentration with the
ability to discriminate oil from solids.
Top |
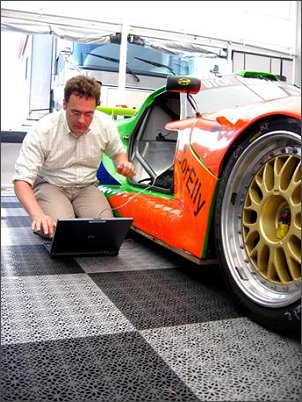
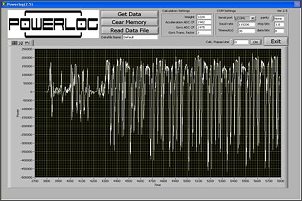
3. PowerLog |
 |
The powerlog is a sensor with PC software
for automotive performance measurements.
It measures independent of the vehicle, the
Power in kW, speed, x-y accelerations,
altitude, position and gyro (covering all
DOF’s). All this data is stored in the
Powerlog and can be read realtime or
afterwards with a laptop.
The powerlog is the only automotive absolute
BHP-meter in the world. Installation time is
20 seconds.
The PowerLog is approved by the “Applied
Research Laboratory – Automotive” in Arnhem.
The PowerLog is/will be used in the FIA GT4,
Supercar challenge ect.
More information about the product and sales
offices can be found on
www.powerlog.nl
The Powerlog is a product of Esquisse.
 |
|
|
4. Power
efficient LED Driver |
|
Led driver 1. Background of
the Invention
To get a certain amount of light out of a
light emitting diode or other solid state
light emitting devices, (to be named LED
afterwards) the amount of current and
voltage needs to be within certain limits.
The light output can be regulated by
changing the current through or voltage
across the LED. The voltage across the LED
when the LED is emitting is called the
forward voltage (to be named Vf afterwards).
Vf changes when the emitting material of the
LED is changing temperature. The light
emitting efficiency can also change with Vf,
current or temperature.
For most LED’s the Vf increases with
temperature and therefore changing the
emitted light. To keep the current and
voltage within specifications of the LED, a
form of regulation is needed when the LED is
driven.
Almost all LED drivers are current driven
drivers. These drivers measure the current
through the LED and keep it constant and
some drivers are more intelligent and change
the current also with change in temperature
or emitted light.
When more LED’s are driven in series, the
sum of all Vf is taken. With, for example 35
LED’s a voltage of 150 could be needed. To
increase to this level of voltage
efficiently, it is common to use linear,
boost, buck or combination circuitries. All
these drivers have certain efficiency,
usually dependent on with how much power the
LED is driven.
2. Problems and Disadvantages
Overcome by the Invention
All current LED drivers generate heat and
are not very efficient. When multiple LED’s
are used in series the drivers need higher
voltage discrete devices which make the
driver expensive. Especially when a
combination of different colour LED’s are
used, easy predefined light settings can be
generated and kept stable.
3. The Essential Features of the
Invention
- The invention does not generate any
heat and therefore very efficient.
- The invention has the ability to
regulate on power instead of voltage or
current. The invention has the ability
to be manufactured in a standard wafer
process.
- The invention has the ability to
change the regulation slope to
predefined values by changing voltage or
current response.
- The invention has the ability to be
fed by the voltage difference across the
LED
- The invention does not any discrete
components to be functional.
- The invention makes it easier to
design an efficient power supply because
of the fixed voltage output.
- The invention can easily be
controlled by a microprocessor or
communication device. This gives the
invention the ability to drive multiple
LED’s and generate different light
effects.
- The invention makes it possible to
make pulses that can have any shape
possible.
- The ratio of the gains from the Vf
and the measured voltage across the
shunt resistor can be set to meet the
most optimal regulation.
- When there are large distances
between the LED and the power supply,
the invention can be placed close to the
LED to be able to increase supply
voltage and reduce cable losses.
|
|
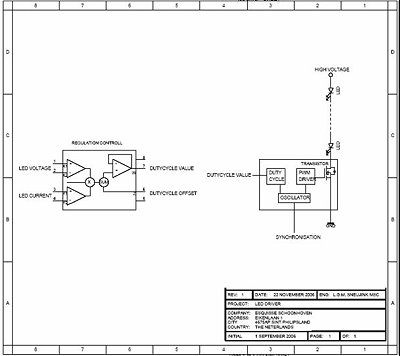
4. The design To improve
efficiency, temperature dependency and other
artefacts, a new LED driver is designed.
This driver is hardly using power and can be
fed by the Vf across the LED itself.
Because the LED driver is extremely stable
it can be used for LCD LED backlights, home
lighting etcetera. The driver uses the given
fact that a LED can be driven with power.
This can be realized by driving the LED with
pulses where the pulse with is regulated by
the measured voltage across, current through
and/or power consumed by the LED. This has
the advantage that the power supply can be
optimised for a predefined voltage. This
predefinition makes the power supply more
efficient.
Because this driver can be placed at the
minus side of the LED, no high voltage is
needed to supply the driver and therefore
making a realization for building the
functionality in a chip fairly cheap.
When a power supply of, lets say, twice the
maximum Vf of the LED, the time the LED can
be switched on must be reduced by such a
duty cycle, that the LED does not exceed
it’s stated maximum rating. This maximum
rating is determined by the expected
lifetime, and can be different from the
supplier’s datasheet.
The emitted light can be controlled by
changing the duty cycle value of the driver
or manipulating the measured led voltage or
led current. The LED current can, for
example be measured by a resistor in series
with the led and the LED voltage can be
measured across the LED. This measurement
must be fast enough to keep the LED within
its limits.
The frequency of the pulse with modulated
signal is chosen high enough to keep the die
temperature of the led within such a
bandwidth that it stays within its estimated
lifetime. This means that the die
temperature is kept constant with only
slight fluctuations.
The control loop is controlled by a measured
signal that can be manipulated by predefined
settings and drives the pwm controller. When
for example the current through the led
increases; the duty cycle of the pwm
controller is decreased and when the control
loop is controlled by current, the loop is
closed and stable.
Because the driver adjusts the on-time of
the LED, it doesn’t regulate the current
through or voltage across the LED but
regulate the power averaged in time. This
means that its supply voltage independent
and capable of regulating the power through
the LED up to 3 times the Vf of the LED at
nominal conditions.
Hence the whole control of the pwm
controller is based on a voltage measurement
across one or more LED’s and current through
the LED’s. The voltage and current signal
can be processed in a micro controller or
analogue computer, to make its behavior more
predefined.
The calculation of the desired pulsed with
modulation duty cycle can be solved
hardware- or calculated software wise and
can be made temperature or surrounding light
dependant..
In the scheme the switching device is of a
transistor type. This can be any kind of
switching device.
Synchronization of the oscillator can be
used to use the invention for data
transmission with multiple LED’s functioning
as transmitter. |
5. Applications of the Invention
The invention can be used in different
applications. This can be:
- LED LCD backlight with for example
dimming and/or scanning
- Home applications
- LED televisions and screens
- Station screens
- Garden lighting
- Battery supplied lighting
- Video screens
- General lighting
On request Reference designs can be
delivered for evaluation.
Top |
5. Optical
filament temperature measurement of a hot
cathode fluorescent lamp |
The filament temperature is important for
the lifetime of a fluorescent lamp. If the
lamp is burning in a modulated mode, the
lifetime and level of modulation greatly
depends on the filament temperature
accuracy.
The filament is a tungsten spiral shaped in
another spiral. The middle of the filament
is coated with barium to stimulate the
release of electrons. The filament
resistance changes with temperature and in
time. Therefore it’s difficult to maintain
the same temperature of the filament.
Emission is:

Equation 26
It’s clear that absolute temperature is the
biggest factor in the equation.
Hypothesis:
When a current flows through the filament,
the temperature of the filament can be
measured with a sensor that senses the
emitted electromagnetic radiation on a
wavelength that is not available in a
burning lamp. With this signal the
temperature of the filament can be
regulated.
To make an optically regulated power supply
that regulates the consumed power through
the filament to keep the filament
temperature on a predefined value and detect
if the filament is connected to its
connection wires and detect possible other
interesting lamp behavior.
To prove the hypothesis several tests are
performed to determine the wavelength of
interest and its behavior.
It is clear that the irradiance of the
filament is cumulative on the lamp
irradiance and in previous measurements the
relation between irradiance and filament
temperature is proven. When the intensity,
for example around 870nm is measured the
filament temperature can be determined.
It is clear that the phosphor does not have
significant influence on the radiated
spectrum. Only small differences can be
found in the visual band where absorption
decreases the intensity non-laniary with
respect to the wavelength. This means that
clean lamp ends are not needed to measure
the intensity.
Measuring the filament temperature with a
photodiode can be very attractive for the
amount of information it’s giving with
respect to the status and lifetime of the
lamp and filament.
Feasible properties:
- 2-degree temperature regulation
possible of the filament
- Deep dimming
- Sputter detection
- Lamp burning detection
- Estimated lifetime lamp
- Less components needed
- Cheaper design
- Independent of lamp tolerances
- Longer lifetime lamp
Also increased irradiance during a cold
start can be an advantage using this system.
Enough literature is available to underwrite
the hypothesis, this means old technique in
a new application.
Top |
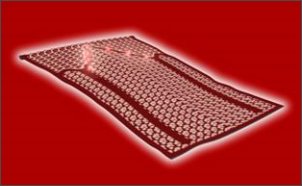
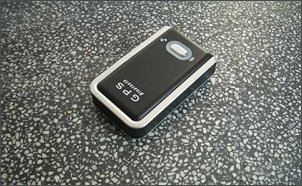
6. Mecca Finder
The mecca finder is an electronic piece
of equipment that always points towards
Mecca or other pre-programmed destination.
The mecca finder does not contain maps. It
contains only one button so even small
children/elderly can use it.
The mecca finder is available in two
versions. Build in LED pointing arrow in a
carpet or as a matchbox sized pointing
device. The production will ramp up to
500.000 pcs
The mecca finder is a joint venture with
Rheinisches lichtwerk Gmbh.
|
|
Top |
7. Redundant
Power Supply Telecom
 |
A customer asked to
develop a redundant
powersupply to realize increase
availability.
This is achieved by using two
powersupplies
and adding OR-ing electronics
inclusive failure
detection circuitry. When one
power supply
fails the other power supply
takes over.
The power supply has a redundant
5,-27,-48,
CR.
Production will ramp up to 100
pcs each year. |
Top |
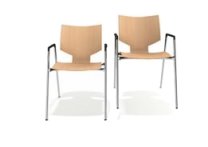
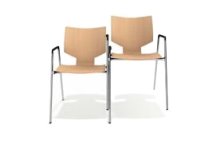
8. Project Chair |
|
In the train towards London we
met Mr. v.d. Winkel form Casala.
We talked and we told him our
business. He asked if we could
develop a chair, conform the
latest rules and regulations
regarding. The chair should be
easy to couple and stack. This
resulted in the following chair
which received the RED DOT award
for excellent quality product
design. Look for yourself and
get carried away with the unique
and fastest coupling chair in
the world. By using different
steel types, tube diameters,
wall thickness and extensive
simulation, we were able to
develop a chair that was strong
enough. In total over 300
virtual models were made. The
design is cooperation with
Kommerkors. The production will
ramp up to 100.000 pcs per year.

|
 |
|
 |
 |
|
 |
 |
Top |